Data Walk Workshop
Dipartimento di Design, Politecnico di Milano | May 8-12, 2017
Special Thanks to Paolo Ciuccarelli (Program Director) and Tommaso Eli (Teaching Assistant)
Overview
How can design put data in its place?
During a week in early May, I led a workshop at the Politecnico di Milano to investigate this question. A group of twenty-nine Communication Design students participated. They worked in small teams to explore the design opportunities and challenges posed by situating data in an unfamiliar setting: a walk.
Today, in 2017, we often think of data and place as being independent of one another (Loukissas 2016). Data are infinitely small, technical, and abstract while places are spatial, social and experiential. Nevertheless, data and place are linked. Indeed, “data walk” is not an oxymoron. For data can only be made and made sense of in places of production and display.
Data don’t live on the head of a pin, or a hard drive. Easy enough to say. Over the course of five days, I asked students to show how data and place are connected by designing walks that would take us through both data sets and data settings. Walking became the algorithm that allowed us to connect data and place in a series of surprisingly evocative encounters.
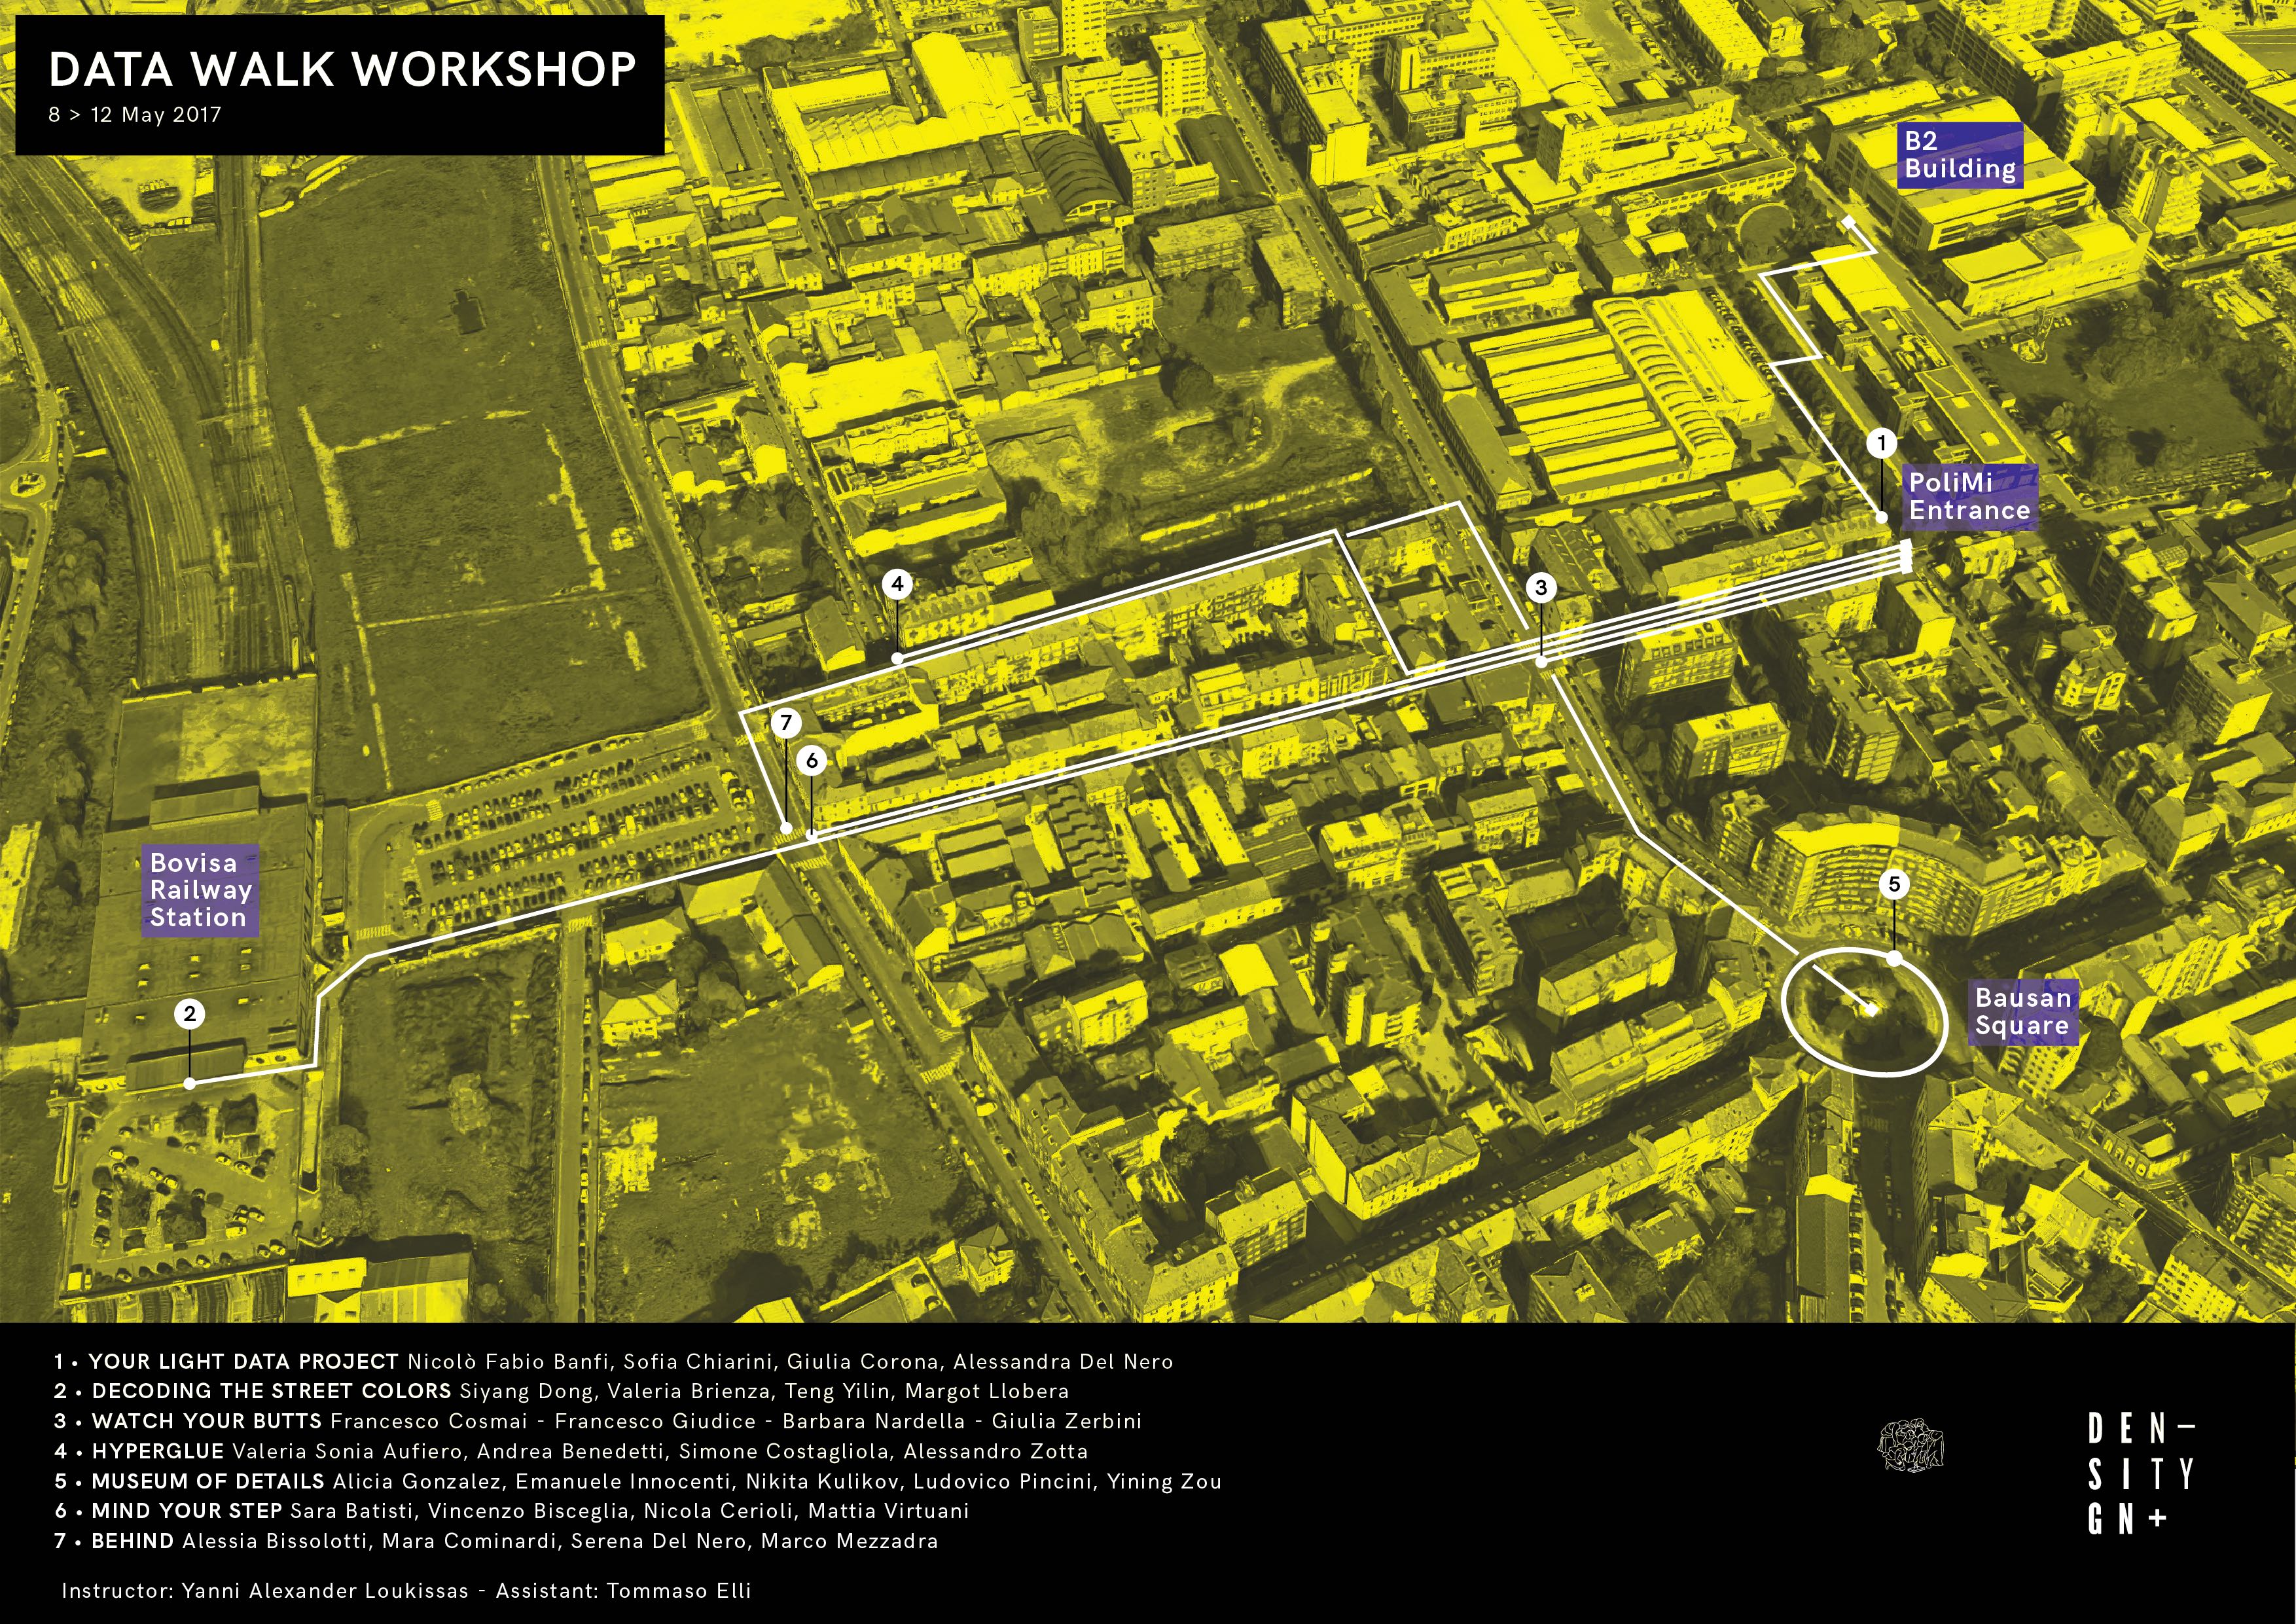
Student projects explored how practices of both collecting and displaying data might be critically reimagined through the structure of their walks. Walks gave rise to creative data collections: unconscious head motions, street stickers, discarded cigarette butts, minute changes in the skin. Walks also placed those data within and around the Bovisa campus of the Politecnico as: a prosthetic for walking, a soundscape, an ironic art installation, and a self-monitoring app. This range of rigorous and whimsical experiments helped us all reconsider the relationship between data and place.
The “Data Walks” workshop would not have been possible without the invitation and support of Paolo Ciuccarelli, professor and director of Communication Design at the Politecnico di Milano and Tommaso Eli, my teaching assistant and guide to Bovisa for the week. Additional thanks to all the members of Density Design Lab, who provided inspiration, moral support, and feedback.
The workshop was structured by a pair of exercises. Both explored the relationship between data and place, but in different ways:
Exercise 1. Walking for data collection
In the first exercise, students explored where data come from and how they are shaped by specific origins. This was not an abstract exercise. They learned hands-on how to make their own data sets. First, they identified a public route along which to collect data. Then, they selected a neglected or invisible subject encountered along that route as the focus of their data collection. I offered a selection of unorthodox procedures to help students develop reflexive collecting practices, such as “don’t categorize,” “use irregular measures,” “note absences,” “rely on your judgment,” and “record your own presence.” Students created and stored data using Flickr (a web app which captures images + metadata tags). Each data set captured (in its own way) what the original route looked like from the perspective of the selected subject. In the process, students learned just how human data collection can be.
Exercise 2. Walking for data display
In the second exercise, students considered the context in which new audiences might encounter their original data set. In this follow up assignment, students learned how data are affected by local settings for display. Still working in groups, they created short (~5 minute) data walks using the sets collected in exercise 1. Their data walks were both physical and informational traversals. They simultaneously took us through spaces and through a data sets, calling attention to the relationship between the data and its surrounding context. Each group choose a procedure to help shape their walk: “narrate,” “materialize,” “participate,” “layer,” or “zoom.” The results were evaluated on three criteria. Concept: what does the data walk help us learn about the local setting? Experience: what does the data walk feel like? And technique: how is the data walk made?
Outcomes
Coming Soon