Yanni Alexander Loukissas

Associate Professor of Digital Media, Georgia Institute of Technology

  • Home
  • About
  • Recent Projects
  • Publications
  • Local Data Design Lab
  • Courses
Uncategorized

A BeltLine for All?

admin
May 20, 2018

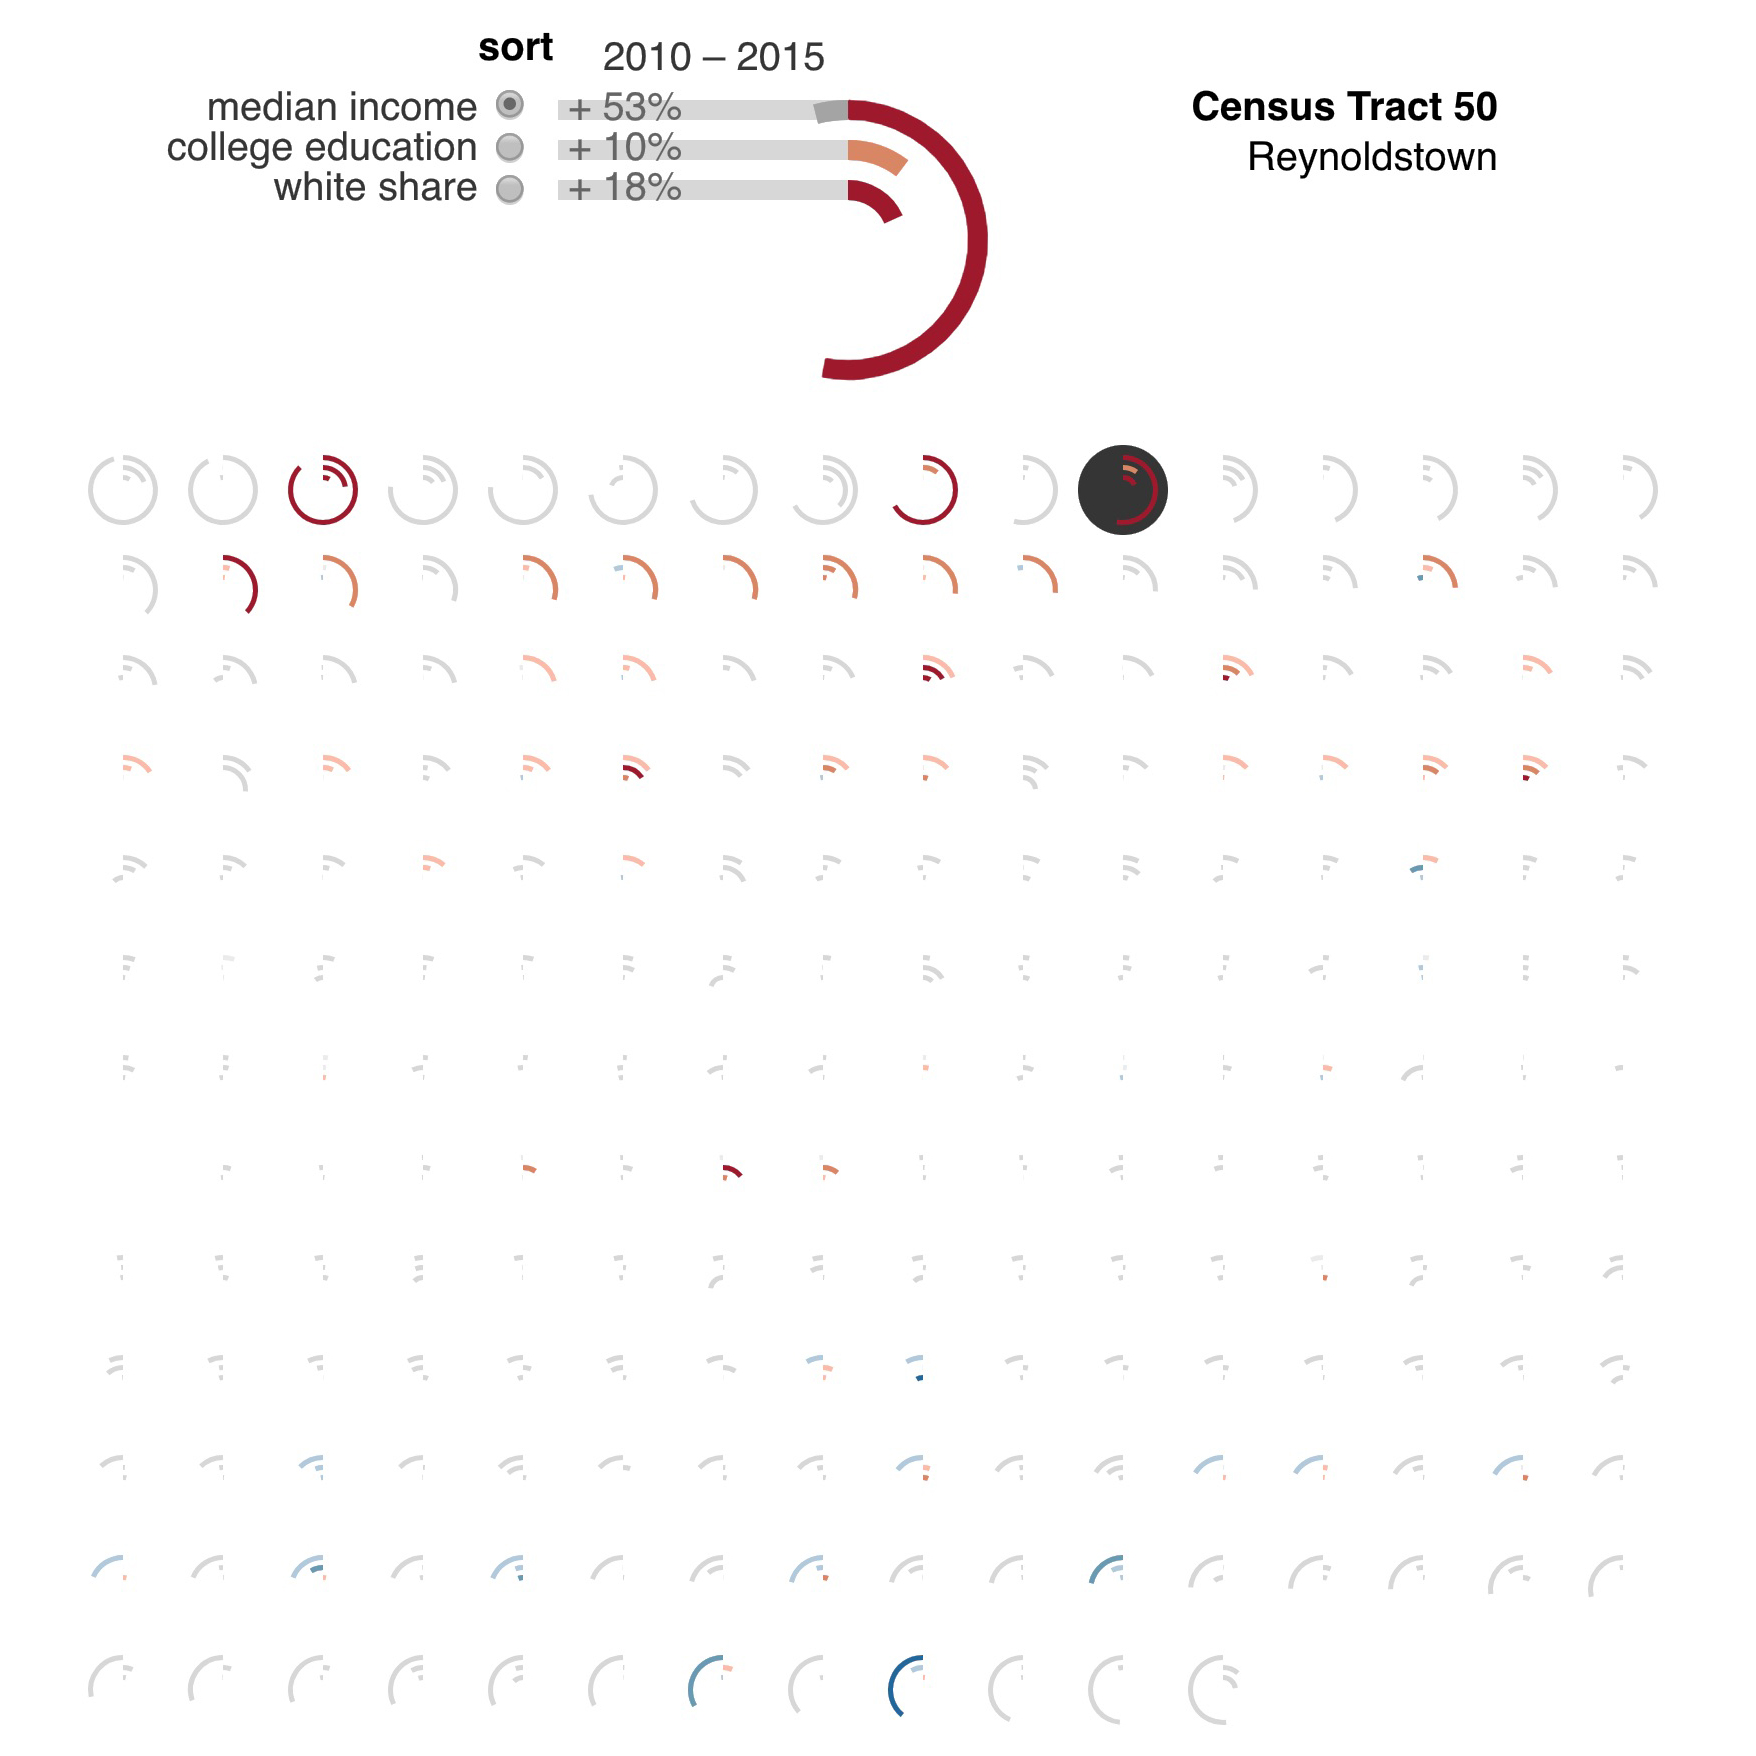
This map visualizes demographic indicators of gentrification in neighborhoods (defined by census tracts) along the current and proposed path of the Atlanta Beltline. Created with Christopher Polack and Peter Polack for a report by the Housing Justice League and Research | Action. See the full interactive visualization here: http://loukissas.lmc.gatech.edu/beltline

PreviousPrevious post: Data Walks
NextNext post:Map Room Project

Contact

Email:
yanni.loukissas [at]
lmc [dot] gatech [dot] edu

Address:
Technology Square
Research Building
85 5th Street NW
Room 318A
Atlanta, GA 30308

Recent Posts

  • The Aesthetics of Data Settings
  • Civic Data Guides
  • Map Room Project
  • A BeltLine for All?
  • Data Walks

Recent Comments

    Archives

    • January 2022
    • May 2020
    • August 2018
    • May 2018
    • February 2018
    • September 2017

    Categories

    • Uncategorized

    Meta

    • Log in
    • Entries feed
    • Comments feed
    • WordPress.org
    Copyright © 2023 Yanni Alexander Loukissas | Theme by: Theme Horse | Proudly Powered by: WordPress